
|
![]()

( 5 ) CHAPTER 8 THE USE OF THE INDUSTRY ATTRACTIVENESS-BUSINESS STRENGTH MATRIX IN STRATEGIC PLANNING
ESSENTIAL ELEMENTS OF THE ATTRACTIVENESS STRENGTH MATRIX
In the early seventies, General Electric was exposed to the ideas then sponsored by the Boston Consulting Group, which are espoused in the growth-share matrix approach. GE found that approach quite appealing, particularly, the ability to display in a visual representation the portfolio of the business of the firm in terms of two central dimensions: the industry attractiveness for each respective business, and the internal strength that the firm commands in that business. The value of such a tool for a multi-business organization was quickly detected by GE, especially for assigning priorities to each business leading toward rational investment and resource allocation decisions. The primary objection raised by GE to the use of the growth-share matrix was the reliance upon single descriptors to characterize industry attractiveness [that is total market growth rate], and business strength [such as relative market share]. It was concluded that a wide variety of critical factors, other than those enumerated in the growth-share matrix, needed to be identified and assessed in order to construct an appropriate business portfolio representation. Accordingly, GE retained the services of McKinsey and Company to develop what is now a highly popular and powerful portfolio approach: the industry attractiveness-business strength matrix. Our presentation of this subject follows Hax and Majluf [1983].

Figure 8.1 depicts the basic elements of the attractiveness-strength matrix. Prior to explaining in detail the necessary steps to implement this matrix, we will present an overview of its primary elements. They are the identification and assessment of both external and internal factors, and the suggestions for strategic action. The identification of critical external factors, which are noncontrollable by the firm , leads to the determination of the overall attractiveness of the industry in which the business belongs. Figure 8.1 lists some external factors, that have proven to be useful, in a variety of situations, to assess the attractiveness dimensions. In a similar way, we need to identify the critical internal factors, also called critical success factors, which are largely controllable by the firm. The position that a business achieves in these factors, vis-a-vis the key competitors, will determine the ultimate strength possessed by the firm in each business. Again, Figure 8.1 provides an illustrative list of such factors. Notice that many of them [sales, marketing, R&D, customer services, manufacturing, and distribution] represent managerial functions. This serves to emphasize the fact that, ultimately, a strategy has to be defined in terms of specific multi-functional programs for each business. Once external and internal factors are identified, we have to assess these factors and position each business in terms of overall industry attractiveness and business strength. A nine-cell grid results, as indicated in Figure 8.1, by using three categories [high, medium, and low] to classify both attractiveness and strength. The suggestion for strategic actions are expressed in terms of the following basic thrusts: - Invest to grow - Selectivity to grow - Selectivity - Harvest or Divest.
A METHODOLOGY FOR THE DEVELOPMENT AND USE OF THE ATTRACTIVENESS-STRENGTH MATRIX
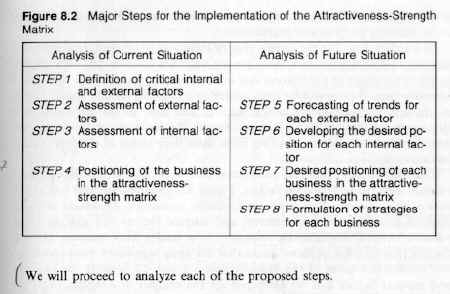
Figure 8.2 identifies the major steps for the implementation of the attractiveness-strength matrix. A clear separation has been made between the current state and future projections in the assessment of internal and external factors. The positioning of each business unit in the current state simply involves an objective evaluation of the overall industry attractiveness and business strength performed with historical and actual data. However, the future positioning requires predicting the trends of each of the external factors in order to obtain a forecasted profile of the industry attractiveness. With this information on hand, we develop a business strategy congruent with the desired position of each business in the portfolio matrix. We will proceed to analyze each of the proposed steps:
STEP I; DEFINITION OF CRITICAL INTERNAL AND EXTERNAL FACTORS
A traditional way of starting a business planning effort is to conduct an environmental scanning process to determine the opportunities and threats that the external environment imposes upon the business unit, and internal scrutiny to identify the basic internal strengths and weaknesses inherent to the business. This process is begun by recognizing the key factors which will be subjected to initial assessment. We favor distinguishing these factors into two different groups. One is the set of critical external factors, which we define as essentially uncontrollable by the firm. They represent basic characteristics of the industry and competitive structure in which the business operates and a host of other concerns, such as sociopolitical, economical, legislative, regulatory, and demographic factors. The firm might, at best, attempt to mildly influence the trends of those factors by negotiating, lobbying, and bargaining with the external agents that will determine their behavior. The other is the set of critical success factors which, to a large extent, are controllable by the firm. They correspond, primarily, to functional activities which have to be deployed to guarantee a successful competitive standing of the business units. The selection of these factors is not a trivial matter. Normally, we approach this step by immersing a group of key executives of the firm, including corporate, business, and functional managers, in a collective effort oriented toward the identification and assessment of those factors. This effort represents a very subtle process that requires a great degree of intelligence, experience, and knowledge about industry and business characteristics. It is unfortunate that the current state of knowledge in management precludes structuring this activity in a more precise way. We have to rely on a largely intuitive treatment of this subject due to the lack of a sounder and more solid scientific base. We are still far from achieving a rich and comprehensive model of the firm to facilitate the performance of this task. In the absence of this theoretical foundation, we at least can submit the managers of the firm to an orderly process aimed at extracting from them their vision of the firm and its environment. One way to approach this descriptive task is to look at standard lists of relevant external and internal factors. Figure 8.1 already presented two broad lists of those factors. This is not an advisable procedure. An honest effort to produce meaningful lists of external and internal factors will give new and valuable insights, engaging the managers in a totally fresh exercise, probing for the identification of those issues that are truly significant to characterize the various businesses of the firm. Figures 8.3 and 8.5 identify the external and internal factors that we developed for the analysis of a business that we will use throughout this chapter to illustrate the implementation of the attractiveness-strength matrix.
STEP 2: ASSESSMENT OF EXTERNAL FACTORS
Once the external uncontrollable factors which are relevant to a business have been identified, we have to determine the contribution of each one of these factors to the level of attractiveness of the industry in which the business belongs. We have found that "profile charts", such as the one presented in Figure 8.3, provide a helpful visual display of the complete assessment. each factor is graded in the following five points scale: = Extremely unattractive - Mildly unattractive E Even or Neutral + Mildly attractive + Extremely attractive. The intent of this evaluation is to assess the level of attractiveness that a given industry has for the firm conducting the analysis. An industry could be highly attractive for a firm, because of the high technological standing in which the firm finds itself, but could be highly unattractive for another firm which lacks the required technological base. To perform the industry assessment we need to classify the factors into two different groups. In one group, there are factors such as total market, market growth rate, and industry profitability, which affect in similar ways all firms competing in the industry. In this case, we favor the selection of the average investment opportunity open to the firm as a selective basis of comparison. The reason for this selection is that the degree of attractiveness will ultimately determine the investment strategy of the firm. Thus, a business ranked in a highly attractive position will be a candidate for a larger allocation of resources than a business classified in a less favored category. When the five point scale in the profile-chart is defined in this way the "Even" or "Neutral" point identifies a degree of attractiveness for every factor which is equivalent to that enjoyed by an average investment opportunity open to the firm. The second group is composed of factors that affect the firm and its competitors in a different way. For example, external factors tend to affect quite differently multinational corporations whose parent firms are placed in different countries, where currency parity, inflationary trends, demographics factors, and manpower supply all tend to have very different impacts. For assessing this latter group of factors, we have to resort to competitive evaluation, and the firm could select its most meaningful competitor as a basis of comparison. In this case, equal or neutral will mean that the factor affects the firm and its most important competitor in a similar way. The degree of attractiveness is then measured in terms of the relative impact to the firm with regard to the selected competitor. The resulting assessment is going to be heavily dependent upon judgment. This is not necessarily an undesirable feature. A true understanding of a business invariably requires managerial insights. The assessment of external factors is a systematic process that allows a more orderly expression of the subjective inputs that managers have to provide when an overall diagnosis of a business is being conducted. Obviously, there are ways to enrich the information base required to make a thorough industry analysis. Surveys, marketing research efforts, and external data sources can be valuable complements. They may be acquired either through external sources or by using the professional and research capabilities of the in-house staff. In either case, rather than launching a blind hunting expedition that might provide very little useful information at a great cost, it is better to conduct first this highly judgmental exercise, as a way of bringing in the intelligence that resides among the managers of the firm in an orderly fashion. Figure 8.3 illustrates the industry-attractiveness assessment conducted in 1979 for a business of a Swiss firm in a highly technological industry. The order of the factors does not correspond to any particular ranking. It simply represents the sequence in which factors were identified by managers participating in the evaluation. All of the assessments of the economic, technological, governmental and social factors, were obtained by comparing the influence of each factors in Switzerland vis-a-vis the U.S. external conditions. This is not an uncommon situation for multinational firms, which have a different set of environmental circumstances gravitating upon them. They influence adversely or positively the characteristics of their industry. However, the set of external factors grouped under the heading Industry Factors, by and large, affect in a similar way all the firms competing in that industry. The comments attached to Figure 8.3 provide a concise summary to explain the classification of each factor in the assessment of industry attractiveness. The last step still to be resolved is the final classification of the overall attractiveness of the industry in terms of the three categories of the matrix: high, medium, and low. One school of thought, represented in the example given in Figure 8.4, advocates a quantitative approach to this issue. It requires assigning, to each factor, a weight [normalized to 100%], and a numerical grade from 1 to 5 [1 being very unattractive and 5 highly attractive]. The final score of the industry attractiveness is determined as the weighted average of the numerical grades. This cardinal measurement will allow an exact positioning of the business unit within the matrix. This approach is highly questionable. Within an apparent objectivity, it hides the inherent complexities of quantifying very subtle issues. Rothschild [1976, p.151] commenting on this approach says: "I have found that weighting clouds the real issues and generates a reverence for numbers that may be unwarranted. In effect it tends to make a pseudo-science out of an art". A better, though more judgmental way to perform the final classification of an industry, is for the managers conducting the analysis to examine in a detailed fashion the impact of each factor. Once this review is completed, they should engage in an open discussion regarding their relative importance. In this process, factors may be ranked in terms of their influence over industry attractiveness, as a way for participating managers to develop a feeling for the relative importance of each factor under consideration of the industry, expressed directly in terms of the high, medium, or low categories. The reasons for advocating this approach is that the nine cells defined in the attractiveness-strength matrix gives us a sufficient resolution for assigning an appropriate investment strategy for each business. In our example, due to the extraordinary impact of the quite adverse industry factors, the industry attractiveness was judged to be low in 1979.
STEP 3: ASSESSMENT OF INTERNAL FACTORS
The evaluation of the controllable success factors is normally done with regard to the leading competitor participating in the business under consideration. It is important to concentrate the evaluation on a single competitive firm. If there is more than one significant competitor against which we would like to identify competitive strategies, several evaluations should be conducted considering only one firm at a time. What should be avoided is selecting as a basis for comparison in each factor that particular firm that happens to excel in that dimension, since the resulting profile projects an unrealistic disadvantage of the firm under evaluation. Figure 8.5 provides the business strengths profile chart for the analysis of the business whose industry attractiveness was discussed in Figure 8.3. The same five-point scale is used in the evaluation. The fact that the business strength evaluation has a clear competitor in mind makes its assessment less ambiguous than the industry attractiveness. In this case, the points of the scale identify the following competitive posture: = Severe competitive disadvantage - Mild competitive disadvantage E Equal competitive standing + Mild competitive advantage ++ Great competitive advantage. The comments in Figure 8.5 provide the reasoning for assigning the corresponding scores to each factor. Once more, we would like to emphasize that most of those factors represent a managerial function which is, by its own nature, a controllable and critical success factor. The implication is that a successful strategy for a business should coherently put together a set of well integrated R &D, production, marketing, finance, and distribution programs. The quantitative approach favors the computation of a weighted average, which requires the assignment of weights and ratings for each factor. An example of this approach is presented in Figure 8.6 The qualitative approach was used in the Swiss firm example presented in Figure 8.5. It was easy to conclude that the existing composite business strength was medium
STEP 4: CURRENT POSITIONING OF THE BUSINESS IN THE ATTRACTIVENESS-STRENGTH MATRIX
Having made the overall assessment of industry attractiveness and business strength, it is a simple matter to establish the current position of the business in the portfolio matrix, as shown in Figure 8.7 This positioning is limited to assigning the business unit in just one of the nine cells of the matrix. A different procedure is applied when using the growth-share matrix approach popularized by the Boston Consulting Group, in which each individual business unit falls into a precise point, quantitatively determined by the value of the coordinates used in that case [growth and relative market share]. Also, the relative contribution of the business is projected by the size of the area within each circle. Those who subscribe to the weighted-score approach retain that representation in the attractiveness-strength matrix, thus providing a quantifiable set of coordinate measurements. For example, Hofer and Schendel [1978] use a graphical display similar to the one given in Figure 8.8, in which the areas of the circle are proportional to the sizes of the various industries involved, the firm's current market share in each industry is depicted by a pie-shaped wedge, and the circles are centered on the coordinates of the business units [industry attractiveness and business strength position scores.] There is one application of the attractiveness-strength matrix that deserves a separate comment. Rothschild [1976], a specialist in strategic planning with the General Electric Company, suggests a set of factors grouped into five major categories: market, competitive, financial and economics, technological, and sociopolitical.
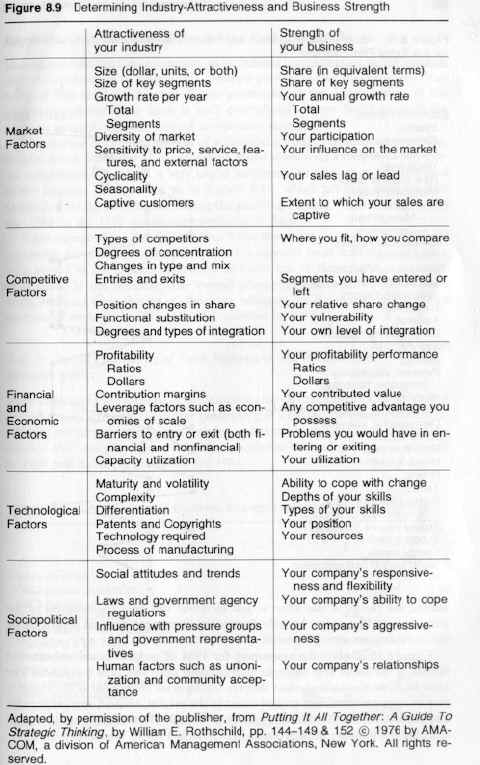
The detailed list of the factors in each category is presented in Figure 8.9. Rothschild, instead of prescribing the identification of a specific list of uncontrollable factors for describing the environmental characteristics and a set of controllable factors to assess the internal strengths, recommends the use of a unique generic list to be applicable to the assessment of both the industry attractiveness and the competitive strength of the firm along each factor. This procedure may also lead to an acceptable business positioning in the matrix. However, it skips the process of generation and probing of the lists of factors, which is enriching and fundamental to gain a deeper and common understanding of a business.
STEP 5 FORECASTING OF EACH EXTERNAL FACTOR
The first step in assessing the future portfolio of the firm is to forecast the trend of each of the external factors. The composite of all these trends will determine the future overall attractiveness of the industry. Step 5 is quite similar to Step 2, except that instead of casting judgments based on objective historical information, our assessment is now relying upon our ability to understand and predict future trends. This procedure is at the core of the strategic planning effort. The principal objective in this step is to gain an understanding of the most likely environment the firm will be facing in the foreseeable future. By determining future trends in the critical external factors, the firm will be able to anticipate explicitly what are the competitive, economic, financial, sociopolitical, technological, and legislative assumptions on which its proposed strategic actions will be based. Often, this step does not lead to the identification of a single most likely projection, but to a series of alternative meaningful scenarios. In this case, contingency plans should be readily defined to address the eventual realization of alternative scenarios that depart in a substantive manner from the most likely one. The final aim in this effort is to determine whether the industry in which a business competes is going to maintain, increase, or decrease its current attractiveness within a planning horizon that normally covers a five year span. Ultimately, the thrust of this effort is just to detect this final displacement of the attractiveness dimension, because the proper investment decision supported by the attractiveness-strength matrix will be dictated by it. Figure 8.10 displays the assessment for 1984 of each of the critical external factors of the Swiss firm example, overimposed upon the 1979 evaluation. The most important transformation that are taking place are present in the industry factors, where a consistent improvement in the market, volume, market growth, and profitability of the industry is being predicted. These changes lead to repositioning the industry attractiveness from low in 1979 to medium in 1984.
STEP 6: DEVELOPING THE DESIRED POSITION FOR EACH INTERNAL FACTOR
Having resolved the future industry attractiveness corresponding to the business unit, the next step is to determine a strategic positioning for the future development of that unit. At the core of this positioning is the determination of the competitive moves to be taken in each controllable success factor to guide the business into the resulting desired competitive strength. The essence of the formulation of a business strategy resides in establishing, in clear terms, multi-functional programs aimed at securing a long-term sustainable competitive advantage. A very useful instrument to advance in this direction is the business profile, such as in Figure 8.11, which projects each internal factor into the desired position during the planning horizon. Figure 8.11 overlaps the 1984 on the 1979 assessment conducted in Step 3. What emerges from this figure, in our Swiss firm Example, is an extraordinarily aggressive set of actions intended to reach a superior or at least equal standing with regard to the leading competitor in every one of the critical controllable dimensions of the business. The overall competitive strength of the business units, resulting from this set of decisions, relocates the business from a medium position of strength in 1979 to a high position in 1984].
STEP 7: DESIRED POSITIONING OF EACH BUSINESS IN THE ATTRACTIVENESS STRENGTH MATRIX
After completing the forecast of the industry attractiveness and the development of the business strength, the proper positioning of a business in the attractiveness-strength matrix may appear as a simple mechanical exercise to show a graphical display. For example, Figure 8.12 shows both the business position as assessed in 1979 and its future projection for 1984. In practice Steps 6 and 7 are carried out simultaneously. The idea is that having determined the projected attractiveness for the industry, we first decide on what the global competitive strategy should be regarding the business strength we would desire to have. Subsequently, we identify the new positioning of each one of the controllable success factors to achieve that overall business strength. The global strategy chosen has to be fitted to the actual internal capabilities of the firm. Rothschild [1976] suggests a slightly different and provocative approach for this step. He also starts by identifying the current positioning of the business in the matrix. This position is displayed by a circle in Figure 8.13. Then,he proceeds to evaluate what the future position would be if we were to maintain our current strategy for that business, that is, if the level of resources committed to the business would remain unmodified. Figure 8.13 shows this future position by the rectangle, indicating that the industry in this case would maintain its medium level of attractiveness , but the firm's competitive position would erode from a high to a medium strength if the current strategy were to be maintained. With this information on hand, the firm should now decide what strategy should be implemented to attain the desired future position of the business, shown in Figure 8.13 by the star. In this example, the firm is committed to increase the resources currently allocated to its business, in order to maintain its strength. Figure 8.14 is intended to summarize the basic issues being addressed in steps 5, 6 and 7. The formulation of the base case results in the identification of the most likely scenario -shaped by forecasting the trends in the external factors - and the preferred strategic action programs - determined by deciding the position that should be achieved in each of the controllable internal factors. A subsequent sensitivity analysis is intended to construct meaningful alternative scenarios and to decide the various action programs - determined by deciding the position that should be achieved in each of the controllable internal factors. A subsequent sensitivity analysis is intended to construct meaningful alternative scenarios and to decide the various action programs which represent the response of the firm to the eventual occurrence of those scenarios. Contingency planning is dependent on the monitoring of the critical external factors to check whether the assumptions about the environment, in which the adopted plans are based, are still valid. Leading indicators and triggering mechanisms should signal significant departures of these basic assumptions and the potential selection of an alternative contingency plan.
STEP 8: FORMULATION OF STRATEGIES FOR EACH BUSINESS
The analysis conducted so far has provided us with all the elements necessary to enunciate the strategy to be pursued for the development of each business. At the level of a business unit the word strategy implies a set of broad action programs oriented at establishing the long-term desired competitive strengths of the business unit, and at properly managing the positive or adverse impact of external factors. Conceived in these terms, the basic strategy is directly distilled from the assessment conducted for both internal and external factors. Thus, the strategy has two primary components. - Broad action program based on the controllable success factors, whose objectives are to neutralize the internal weaknesses while retaining positions of strength. - Broad action programs based on the external factors, whose aims are to prevent the negative consequences of adverse trends over the business performance, and to take advantage of those environmental conditions which represent beneficial opportunities. These two dimensions of strategy formulation have different degrees of creativity and complexity. It is relatively straightforward to identify action programs derived from the internal analysis, because they are directly linked to controllable functional activities. It is much more difficult to address the issues raised by uncontrollable external forces. In our opinion, it is the capturing of the essential message of the external forces and the adaptation of the firm to meet those challenges that distinguishes the creative manager. This analysis is truly significant for the first cycle in the strategic process, where we are formulating broad statements of objectives and action programs. After these objectives have been properly sanctioned at the corporate level, the second planning cycle, dealing with strategic programming, is initiated. At this stage, the broad strategic action programs are going to be broken down into very specific tactical plans,suitable for implementation. Also, the impact of the overall strategies will be subjected to detailed quantitative financial analyses. Those analyses will require a different kind of forecasting effort. For each of the meaningful scenarios identified in the previous steps, we will need numerical projections of parameters such as market volume, sales, prices, costs, interest rates, tax rates, and others in order to evaluate the financial attractiveness of the entire plan during a relevant planning horizon. Figure 8.15 illustrates the broad action programs developed for the Swiss firm example. One of the most critical issues addressed in this case pertains to the question of currency parity. Although this issue appears as a devastating disadvantage for an exporting firm, it becomes obvious that it was an extraordinary weapon when considered from the the point of view of purchasing strength. Notice, that there are a couple of items which recognize the need for further information gathering, in order for the firm to acquire a better understanding of its competitive position. Finally, there is one issue that requires bringing in a sympathetic attitude from the government. This is a meaningful strategy for the Swiss firm, because it commands a strong presence in its own country. Probably a strategy of this nature would not make much sense for companies that do not portray such a significant influence in the economy of a country.
FIGURE 8.15: STRATEGY FORMULATION FOR THE SWISS FIRM EXAMPLE
1] Broad Action Programs Based on Controllable Internal Factors - Maintain R&D and Technical standing above leading competitor level. - Implement an automation program leading toward significant increases in labor productivity. - Improve the distribution network worldwide, developing a sense of priorities according to the attractiveness of each individual market. - Reduce manufacturing costs through proper rationalization in every stage of the production process. - Increase number of qualified managers via proper hiring, developing, and promotional procedures. - Maintain market positioning by the allocation of financial and human resources compatible with competitive challenges. 2] Broad Action Programs to Deal with External Environmental Forces - Profit from a possibly temporarily favorable currency situation by taking advantage of a strong purchasing power in terms of: - Switching from national to foreign suppliers. - Engaging in an active acquisition of manufacturing facilities abroad. - Set up a task force to study the legal, financial, and sales implications of currency transfer. - Use local manufacturing, distribution, and marketing facilities whenever possible, seeking partnerships to neutralize trends toward nationalization. - Stockpile raw materials on critical items, and firm up long term contracts for the procurement of those raw materials, taking advantage of the temporary strong currency situation. - Address the issue of manpower shortage by: - Internal development of qualified manpower at all levels. - Seeking an increase government support. - Establish the base for a systematic information gathering conducive toward a better understanding of competitors and market opportunities.
IMPLICATIONS FOR STRATEGIC POSITIONING
The strategic implications that are normally drawn from the attractiveness-strength matrix have, as a primary message, the assignment of investment priorities to the various businesses of the firm. In that sense, it is truly a guide for resource allocation. This matrix does not emphasize the question of cash-flow balance, a fundamental concern in the growth-share matrix. The prescription that emerges from the matrix is to concentrate resources in those businesses that enjoy a higher degree of attractiveness and competitive strength, disengage resources when the opposite is true, and be selective in intermediate positions. The thrust of the ranking implicit for investment priorities is shown in Figure 8.16. More specific guidance in terms of supporting strategies congruent with those investment priorities have been developed by A.T. Kearney, and are shown in Figure 8.17. The Royal Shell Dutch Company adopted a slight variation of the attractiveness-strength matrix, which they name Directional-Policy Matrix. Its implications for investment priorities and corresponding supporting strategies are given in Figure 8.18. The strategies suggested from these interpretations of the attractiveness -strength matrix are so-called natural strategies, that is, logical and rational directions to be sought for the development of individual businesses consistent with the position they exhibit in the external and internal dimensions. Although they raise valid points to be considered when deciding on a business direction, natural strategies should not be followed blindly. Another important concern is to address the dynamics of business behavior. We should avoid drawing definitive conclusions from static snapshots of the position of each business. Notice that in the example of the Swiss firm, the mere examination of the current portfolio matrix [Figure 8.12] would have indicated that the business should have been harvested or divested. However, the forecasted increase in the business attractiveness [which was based on hard facts and not on wishful thinking], led managers to pursue an investment strategy to improve the business competitive strength. Incidentally this strategy proved to be quite effective.
PORTFOLIO VISION IN THE ATTRACTIVENESS-STRENGTH MATRIX
All portfolio matrices can be applied at several levels in the organization, with different degrees of aggregation as far as the unit that is subjected to the analysis. We have emphasized, so far, the methodology to implement the attractiveness-strength matrix at the business unit level. Another type of powerful message can be extracted when all businesses of the firm are finally positioned in the matrix to provide us with a view of the strength of the overall corporate portfolio. A good representation is obtained by the development of a series of matrices containing not only the position of the businesses but also their contribution measured in terms of a variety of performance indicators, such as: sales, profits, assets, and return on net assets. Figure 8.19 provides an illustration of such display. There is a powerful diagnostic message to be derived from the five matrices portrayed in this figure. For the sake of brevity, we will let the reader reflect upon it. Although in this example the performance measurements are expressed in terms of percentages, it may be valuable to add absolute magnitudes of some selected indicators. Moreover, in this example the indicators selected are given in an aggregate form for each of the nine cells of the matrix, one might want to single out the values associated with each individual business unit. This all-encompassing view of the firm derived by using the matrix can also be extended to produce a more detailed appreciation of a business unit. In that case, a similar in-depth analysis of each one of the product lines should be performed. This would imply a much more detailed segmentation of the matrix with the purpose of helping a diagnostic process at a business level. The final aim is the identification of those sub-segments that deserve either a greater or lesser degree of support.
CONSISTENCY OF INVESTMENT STRATEGIES
Rothschild [1980], proposes a procedure to check whether the resource allocation proposal for each business is consistent with the assigned investment priority for that business [see Figure 8.20]. This is accomplished by measuring the historical level of expenditures during the last six years in: plant and equipment, marketing, engineering, working capital, and salaried employees. These expenditures are compared with those proposed for the next three years in terms of both real dollars and as a percent of sales. Depending on the degree of deviation of the future from the past, the plans are classified as: aggressive, moderate, maintenance, or minimum. Those proposals that fall in the diagonal of Figure 8.20 are judged to be consistent with the investment priorities. Those falling above the diagonal command a higher than expected resource allocation, and those below it, a lower one. A position of the business outside the diagonal, simply signals a discrepancy form a natural strategy whose cause deserves careful investigation. There may be various reasons for a business to have more or less aggressive investment strategies than what might seem natural to adopt. In his book on Strategic Alternatives, Rothschild [1979] devotes a great deal of attention to another consistency issue: the linking of the overall investment strategy with the natural functional strategies that might be considered to support a specific investment thrust. One message in that book is that successful management strategies tend to be driven by a concentration on a particular functional focus.
A CRITIQUE OF THE ATTRACTIVENESS-STRENGTH MATRIX APPROACH
The Ambiguity Implicit in a Multidimentional Matrix
It is an ironic paradox that one of the problems associated with the attractiveness-strength matrix arises from one of its fundamental contributions. Historically, this matrix emerges as a response to the rather simplistic approach of the growth-share matrix. The attractiveness-strength matrix requires searching for the multiplicity of factors that contribute to the strategic positioning of a business. By doing so, it rejects a rather simple-minded attempt to capture the complexity of management,and offers a richer and more mature perspective to guide the proper strategic actions for business development. In attempting to resolve that issue, it introduces the complexity of dealing with multidimensional indicators. We have criticized the weighted-score approach because of its pseudo-scientific character. However, the weighting process, when dealing with multiattributes, is unavoidable, whether you do it explicitly or implicitly. Very often, when applying the attractiveness-strength matrix, one notices a lack of consistency in reaching a final positioning of a given business among groups of managers that have been entrusted with the same task. Also, there is a tendency to categorize a business as medium due to inappropriate understanding of the issues involved, and inability to reconcile diverging opinions. Finally, it is hard to impose a uniformity of standards among business to ensure that the final portfolio matrix will be consistent in terms of the criteria used in their classification. Several firms try to bypass this difficulty by developing standard lists of external and internal factors to be used by all businesses in the firm. We find that this practice prevents the recognition of the idiosyncratic characteristics of each business and presents obstacles for a rich diagnosis of its strengths and opportunities. In contrast, the growth-share matrix becomes a much more precise and unambiguous tool. It can be easily applied to facilitate comparisons among the portfolio strength of competitive firms. Although there is conceptually nothing that would prevent applying the attractiveness-strength matrix not only for one's own firm but also for the competitor's, it is a much more difficult tool to be used objectively in that capacity. Therefore, we recommend the growth-share matrix as a useful mechanism for competitive analysis, and the attractiveness-strength matrix as a much more powerful one for diagnosis and strategic guidance tool for one's own firm.
The Difficulty of Assessing Industry Attractiveness
Although the ambiguity we have described can be applied to both dimensions in the attractiveness-strength matrix, it is clearly the industry attractiveness perspective that is most affected. In assessing business strength, at least we have a clear relative standard of comparison: the leading competitor. As we have discussed Step 2, the evaluation of industry attractiveness in much more complex and subtle.
The Legitimacy of the Investment Priorities
A more technical point that one could raise as a critique of the attractiveness-strength matrix is the subjective nature of the priorities assigned for investment purposes among the businesses of the firm. From a strict financial theory point of view, one could argue that the only legitimate evaluation tool is the Net Present Value [NPV] of future cash-flows to be generated by a business, discounted at a proper cost of capital, which includes an adjustment for risk. Those who support a broad categorization for an initial ranking of investment priorities, as the one resulting from the attractiveness-strength matrix, argue that the cash-flow projections required in the NPV calculations ignore the qualitative merit of an investment. If one wants to play the NPV game, it is always possible to show that an investment opportunity can meet the cost of capital hurdle. Therefore, it is better to reflect first on the overall attractiveness of the industry in which the investment will take place, and the strength that the firm will bring to bear on that business, prior to undertaking numerical computations that might not add significantly to the understanding of the decision. We feel that both points of view are legitimate, and have important merits on their own. Rather than being alternative procedures for analyzing investment proposals, they truly complement each other.
CHAPTER 9 THE LIFE CYCLE APPROACH TO STRATEGIC PLANNING
The life-cycle concept has long been recognized as a valuable tool for analyzing the dynamic evolution of products and industries in the marketplace. It is derived from the fact that a product's and industry's sales volume follows a typical pattern that can readily be charted as a four-phase cycle known as embryonic, growth, maturity, and aging. The managerial implications of the product life-cycle have been widely documented. See, for example, Clifford [1980], Urban and Hauser [1980], Kotler [1980]. Moreover, the linkage between the industry life-cycle and strategic management has been a subject of increasing attention [Luck and Ferrell 1979]; Porter 1980, Chapter 8]. Also much attention has been given to the relationship between the product life-cycle and management of innovation and product technology [Abernathy and Utterback 1982] Utterback 1978, Hayes and Wheelwright 1979a and 1979b, Moore and Tushman 1982]. Although normally the stages within the industry life-cycle are characterized by their corresponding sales growth, it is important to understand how other financial characteristics impact each state, such as profit and cash-flow. As shown in Figure 9.1. The implications of the life-cycle stages become central for the imlementation and development of strategies in those industries. Accordingly, Arthur D. Little Inc. [ADL] has proposed a fairly structural methodology to guide strategic choices based on the life-cycle concept [Osell and Wright 1980, Forbes and Bate 1980, Arthur D. Little 1974, 1979, 1980] This approach is supported by another type of portfolio matrix, whose primary dimensions are the life-cycle stages and the competitive position. Schematically, the ADL strategic planning methodology is summarized in Figure 9.2. The rest of this chapter is directed to the presentation of that methodology.
THE LIFE-CYCLE PORTFOLIO MATRIX
The businesses portfolio matrix suggested by ADL shares the same attributes of the previous matrices we have discussed - the growth-share matrix, and the industry attractiveness-business strength matrix - that is, it is a pictorial representation of all the businesses of the firm, in two dimensions. One represents the impact of the external forces, normally uncontrollable by the firm. ADL chose the four stages of the business life-cycle as descriptors of the industry characteristics. The second dimension represents the strengths the firm has in the industry in which each of its businesses compete. ADL selected six categories of competitive positioning [dominant, strong, favorable, tenable, weak, and nonviable]. Figure 9.3 presents the six by four resulting portofolio matrix.As is the case with all of the previously discussed matrices, the position of a business unit within it suggests the pursuit of some natural strategic objectives. Often, a major way of articulating those objectives is to reflect upon a desirable market share position, the need to deploy financial resources to support investment requirements, and the expectations with regard to cash flows required from or contributed to the corporation. Figures 9.4, 9.5 and 9.6 provide some suggestions for strategic positioning according to these three dimensions. The use of this matrix is, therefore, conditioned to three primary tasks. One is to segment the business of the firm into relatively independent SBUs, which will lend themselves to being analyzed in terms of the two dimensions of the matrix. Two, is to guide managers through a systematic process in assessing the stage of the life-cycle in which each business falls. And three, is to provide some support to identify the categories of competitive positioning of each individual business. These three subjects will be briefly reviewed now.
Criteria for Business Segmentation
ADL assigns the label "strategy center" to what we have referred to as Strategic Business Unit [SBU]. A strategy center is a natural business, that is, a business area with an external marketplace for goods or services, and for which one can determine independent objectives and strategies. In order to build business strategies, the first task of managers is to segment the firm into a set of natural businesses. To accomplish that, ADL, suggests the use of a set of clues which are grounded on conditions in the marketplace rather than in internally shared resources, such as sharing of manufacturing facilities, common technology, or joint distribution channels. Once again, the emphasis on segmentation is articulated in terms of the external environment, attempting to establish the roots of business identification in the behavior of competitors, instead of being driven by internal functional arrangements. The clues which ADL offers to define a strategy center are: 1] Competitors 2] Prices. 3] Customers. 4] Quality/style. 5]Substitutability. 6] Divestment or Liquidation. The first four clues indicate that a set of products belongs to a given SBU or strategy center whenever they face a single set of competitors and customers, and are similarly affected by price, quality and style changes. If this is not the case, the set of products might be split into more than one strategy center to focus more sharply its strategic actions. Moreover, all products in a strategy center should be close substitutes of one another. Finally, a strategy center could probably stand alone if divested [Arthur D. Little, 1980].
Identifying the Stage of a Business Within the Life-cycle
ADL identifies eight external factors which are key descriptors of the evolutionary stage in which a business resides within its life cycle. These descriptors are: market growth rate, market growth potential, breadth of the product lines, number of competitors, distribution of market share among competitors, customer loyalty, entry barriers, and technology. [All of these correspond to the category of external uncontrollable factors, which we have addressed in the industry attractiveness or business strength matrix.] Figure 9.7 can be used as a checklist to help positioning a business unit in the life-cycle stages according to each one of these descriptors. Obviously, it will be unlikely that a strategy center falls consistently in a single stage in every descriptor. As usual a judgmental call has to be made to finally capture the essence of the industry maturity of the strategy center. An embryonic industry [such as laser measuring devices] is normally characterized by rapid growth, changes in technology, great pursuit of new customers, and fragmented and changing shares of market. A growth industry is one that is still growing rapidly, but customers, shares, and technology are better known and entry into the industry is more difficult [as illustrated by RCA's attempt to enter the computer business]; a mature industry [like automobiles or paper in this country] is characterized by stability in known customers, technology, and in shares of market, although the industries may still be market-competitive; and aging industries [such as men's hats] are best described by falling demand, a declining number of competitors, and, in many such industries, a narrowing of the product line [Arthur D. Little, 1974]. Most industries reach the maturity phase after passing through embryonic and growth stages. Some industries stay mature for decades or even longer, while others mature quickly. However, industries can experience revesals in their maturing process. Such reversals are quite frequent. For example, as a result of the energy crisis, the aging coal mining industry has, in certain countries like the US., reverted to growth phase. Other examples are the watch and bicycle industries. They tend to be caused by technological change, as in the watch industry, or changes in social values and norms [the case of bicycles], or by economic or regulatory factors [Arthur D. Little, 1980]. Figure 9.8 displays some examples of the stage of maturity for some industries, including some maturity reversals. A more important point is that there is no "good" or "bad" maturity position. A particular stage of maturity becomes bad only if the strategies adopted by an industry participant are inappropriate for that given stage of maturity, or, indeed, if its expectations are inconsistent with that stage.
Identifying the Competitive Position of a Business
ADL has decided to address the question of competitive positioning in terms of a set of subjective and qualitative categories, rather than ascribing a numerical value such as market share, to this dimension of the matrix. Figure 9.9 spells out the attributes of the first five competitive categories - dominant, strong, favorable, tenable, and weak. This sixth one, nonviable, does not need a formal description, because it represents the final recognition that the firm has really no strength whatsoever, now or in the future, in that particular business, and therefore, existing is the only strategic response. Although the broad descriptions provided in Figure 9.9 are meaningful enough to characterize the difference among each competitive position, it might be useful to comment briefly on the nature of their distinct role. There is only one firm in an industry, if any, that can assume a dominant role. If such a firm exists, it truly sets up the standards of the industry. It is Kodak in films, Boeing in commercial aircraft, and IBM in mainframe computers. A strong business enjoys a most definitive advantage over its competitors, with relative market share beyond 1.5, but has not reached the absolute dominance of the former category. A favorable position means that there is something unique about the business. It could result from a differentiating strategy or the exploitation of a particular niche where the firm happens to excell. But we are talking now about attributes in some facets of the industry, as opposed to dominant or strong positions industry-wide. A tenable business is beginning to have some symptoms of erosion and misperformance; however, there is little question that the business deserves full attention and has a good probability for effective recovery. Finally, a business in a weak position is in a transitory situation which cannot be sustained in the long run. It is either up or out.
FIGURE 9.9. CRITERIA FOR CLASSIFICATION OF COMPETITIVE POSITION
1] "Dominant". Dominant competitors are very rare. Dominance often results from a quasi monopoly or from a strongly protected technological leadership. 2] "Strong". Not all industries have dominant or strong competitors. Strong competitors can usually follow strategies of their choice, irrespective of their competitors' moves. 3] "Favorable". When industries are fragmented, with no competitor clearly standing out, the leaders tend to be in favorable position. 4] "Tenable". A tenable position can usually be maintained profitable through specialization in a narrow or protected market niche. This can be a geographic specialization or a product specialization. 5] "Weak". Weak competitors can be intrinsically too small to survive independently and profitable in the long term, given the competitive economics of their industry, or they can be larger and potentially stronger competitors, but suffering from costly past mistakes or from a critical weakness.
PORTFOLIO VISION IN THE LIFE-CYCLE MATRIX
As we have indicated in Section 4 of the previous chapter, it is useful not only to present the position of all the business units of a firm in a portfolio matrix, but also to provide the contribution of each business unit by means of a set of financial indicators, such as sales, profits, assets, and return or net assets. Figure 9.10 represents the overall portfolio of the business of a firm in the life-cycle matrix, and Figure 9.11 further documents the financial contribution of each of these businesses. This information is helpful to confirm the role that an individual business should play according to its classification in the matrix. Obviously, a firm will be better off by having a large fraction of its business in a dominant or strong position and those businesses are expected to have handsome financial performances. However, when looking at the industry maturity dimension, a firm would benefit from having a reasonably well-balanced portfolio. If all businesses are projected toward the aging dimension, the firm might enjoy an excellent current profitability, but very little in terms of future expectations. On the contrary, if the portfolio is biased toward the embryonic side, the firm could have great future potential, but might be unable to achieve it, because of the lack of a current base to support the large commitment of resources required.
THE CONCEPT OF NATURAL STRATEGIC THRUST AND GENERIC STRATEGY
Once the portfolio of businesses has been properly positioned in the life-cycle matrix, ADL introduces three conceptual aids to assist managers in the process of identifying an appropriate strategy for each strategy center. 1] The first of these concepts is the so-called families of thrusts. ADL postulates that there are four families which cover the entire spectrum of business positioning within the portfolio matrix: natural development, selective development, prove viability, and withdrawal. Figure 9.12 shows broadly where each of these four families fit. A "natural development" family corresponds to a business which, because of its industry maturity and its competitive strength, deserves a strong support to assure an industry-wide growth. A "selective development" family, as its name implies, requires concentration of resources in industries which are either particularly attractive or where the firm has a singular competitive skills to exploit. "Prove viability" is inherently a transitory situation which cannot be sustained, calling for immediate actions to change the state of affairs. " Withdrawal" calls for concerted actions to withdraw from the business. 2] Having selected the family of strategic thrust most appropriate for a given business, the manager should select now one specific thrust belonging to that family. For example, the following thrusts can be applied to the natural development family: - Start Up, which could be applied in an embryonic stage when the business unit has strong competitive potential to acquire rapidly a significant strength in that market. - Growth with Industry, which is applicable when the firm is satisfied with the current position of the business, and wants to maintain its existing market share. These conditions exist when the competitive position is either dominant or strong, and the industry has reached a certain stage of maturity. - Gain position gradually useful when modest increase in market share are required for the business to have a more solid position, perhaps applicable when the firm enjoys a favorable status in a growth industry. - Gain position aggressively, a clear thrust when the firm has a tenable or weak position in the early stages of maturity and wants to improve dramatically its current standing to avoid being left out of an attractive industry. - Defend position, which could apply when the firm enjoys an either dominant or strong position in earlier stages of maturity. - Harvest, clearly relevant for the aging stages. 3] The third concept is that of generic strategy. Having selected a specific thrust within the family, ADL proposes a set of 24 generic strategies to choose from, in order to support the development of the preferred thrust. Although these strategies were already described in Chapter 3, for the convenience of the reader they are repeated here in Figure 9.13. ADL does not presume that this list of generic strategies exhaust the full spectrum of alternatives for strategy creation. In fact, they are persistently encouraging managers to add, expand, innovate, and offer new strategic alternative. However, they feel the 24 generic strategies suggested constitute a reasonable broad set, so as to cover some of the more significant options related to the task of strategy formulation. We have found it useful to group those strategies into subcategories which communicate the main area of concern addressed by the strategy. The resulting categories are given in Figure 9.14. In order to link these three concepts of families, strategic thrusts, and generic strategies, ADL has provided a mapping which is given in Figure 9.15. Strategy formulation can never be reduced to simplistic rules of thumb. However, a framework such as this one might be useful, first, to reinforce the concept of natural strategies - namely, to uncover courses of action which might be consistent with the industry and competitive portion of a business - and second, to facilitate a diagnostic process. In this capacity, the ADL framework can assist managers simply by providing a checklist against which to contrast both the strategies which are already in place, as well as those which are being proposed for the development of a business.
In the ADL methodology, the position of a business in the life cycle affects directly the performance measurements used to monitor the quality of strategy implementation. One tool, used for this purpose is what ADL refers to as the Ronagraph, which shows on the vertical axis the return on net assets [RONA] generated by each of the businesses of the firms portfolio, and on the horizontal axis the internal deployment of cash flows. When that number is 100% all cash flows are redeployed and the business is cash neutral. Above 100%, the business becomes a cash user, and below 100%, a cash generator. Moreover, a negative number means that a disinvestment strategy is being applied, because more than 100% of cash flows are being taken out of the business. In the Ronagraph, each business unit is represented by a circle, whose area is proportional to the investment attached to that business unit. Figure 9.16 illustrates a typical Ronagraph, which is used not only to show some key financial characteristics of the business units, but also to compare them with the performance of leading competitors. The zones in the graph indicate the performance to be expected from a strong competitor, which is maintaining its position. Business B is performing exactly according to those expectations, while businesses C and A are above and below this benchmark, respectively. This consistency between financial performance and stages of the life-cycle is not limited exclusively to RONA. A host of other indicators are also expected to perform in accordance with the industry maturity. Some of those indicators are: profits after taxes, net assets, net working capital/sales, costs of goods sold/sales, fixed costs/sales, variable costs/sales, profit after taxes/sales, operation cash flows/sales and net cash flow to corporation/sales. We have briefly commented on Figure 9.1 the expected behavior of sales, profits, and net cash flows, as the business travels through the life cycle. Moreover, Figures 9.5 and 9.6, establish the expected investment requirements, profitability, and cash flow requirements, respectively, according to the position of the business in the life-cycle matrix. For an excellent illustration of the approach for allocating resources derived from the life-cycle matrix, and the financial implications for strategic performance, see Osell and Wright [1980].
We indicated in Chapter 5 that the primary characteristics of strategic management is to seek congruency among all administrative systems, with corporate culture. The ADL strategic planning approach subscribes strongly to this philosophy, providing once more a consistency check among managerial systems within the stages of the life-cycle. The central idea is that the management tasks significantly change as a business goes from embryonic to aging, and therefore, administrative systems, structure, and organizational climate should change accordingly. Figure 9.17 provides a remarkably compact description of the primary characteristics of the managerial systems and organizational climate, within each stage of the life cycle.
The last step in the ADL methodology consists of mixing the degree of risk implicit in the strategy pursuit by an individual business unit. Risk is being assessed in terms of the predictability of profit performance, the more unpredictable it becomes, the great the risk. The risk assessment involves an exercise of high subjectively. ADL identifies several factors which contribute to risk to be assessed independently. These factors are: - Maturity and competitive position, which is given by the position of the business within the life-cycle matrix. The highest risk exists on an embryonic business, which is in a weak competitive position. The lower risk is the dominant business in an aging industry. The risk decreases when moving in the life-cycle matrix horizontally from left to right and vertically from the bottom to the top. - Industry; some industries are inherently less predictable than others at the same stage of maturity. - Strategy; some strategies are more aggressive than others, and consequently imply a larger risk. - Assumptions; the hypotheses regarding the future, in which the strategies are based, could contain different degrees of risk. - Past performance; units with a good track record are less risky than those with erratic records. - Management; the demonstrated ability of the managers in charge of the unit is a central determinant to the predictability of earnings. - Performance improvement; the magnitude of the gap between existing and expected performance is the last important conditioner of risk. Figure 9.18 exhibit the format proposed by ADL for the assessment of the risk analysis.
A CRITIQUE OF THE LIFE-CYCLE APPROACH
There are some major contributions that ADL has made in the area of strategic planning by proposing a comprehensive and structured process to assist managers in the identification of strategic choices. By selecting the life cycle as the central conceptual framework behind that process, ADL has recognized a relevant and widely accepted concept which has deep implications for strategic development, particularly in high technology. Implicitly, the life cycle has been part of the previously described portfolio matrices. However, it has been ADL's contribution to raise that concept to a prominent position within strategic planning, thoroughly exploiting the strategic implications of the life cycle. The resulting methodological approach is,certainly, highly creative, searching for consistency of industry maturity, not only with strategic planning, but with all the other key administrative processes, organizational climate, and structure. From this perspective, the ADL methodology not only is relevant to strategic planning, it addresses also some of the key concerns of strategic management. Finally, the articulation of strategic thrusts and generic strategies consistent with industry maturity and competitive position of the business might either offer constructive suggestions for managers who are not well seasoned in the practice of strategic planning, or, at least, might constitute a useful diagnostic base against which to contrast the existing strategies of an ongoing business. We turn our attention now to limitations that can be raised on the ADL methodology. First, is the overall controversy surrounding the usefulness of the life-cycle concept. Dhalla and Yuspeh [1976] claim that the life-cycle has little validity and the marketing strategies typically recommended for succeeding stages of the cycle are likely to cause trouble: "In some respects, the concept has done more harm than good, by persuading top executives to neglect existing brands, and place undue emphasis on new products". Dhalla and Yuspeh particularly deplore the branch managers tendency to assume that some slump in sales is evidence of having reached its aging stage, prompting the abandonment of the brand. However, their view is drawn from nondurable goods, like cereals and cosmetics, stressing the behavior of brand sales as opposed to business units sales. Porter [1980] also raises some criticisms regarding the life cycle: - The duration of the life-cycle stages varies widely from industry to industry, and it is hard to specify what stage prevails in an industry at a given point in time. - The industry maturity does not always evolve into a well behaved S-Shaped pattern. Sometimes, industries rejuvenate after a period of decline. Occasionally, industries skip stages, particularly when they are affected by passing fads. Also, economic conditions, such as depression, might obscure the true developmental stage corresponding to a given industry. - Firms can affect the shape of the life-cycle curve, primarily through product innovation and repositioning. - The nature of competition is quite variable from industry to industry, depending on the life-cycle stage. For example, some industries evolve from a very fragmentary structure to a highly concentrated one [for example, automobiles]. Others go just the other way around. They begin as concentrated industries and, as time passes, they become more and more fragmented [that is bank cash dispensers]. A legitimate question to be raised is if there is any broadly applicable strategic implication to be derived from the position of a business in the life-cycle, when such important structural changes are occurring simultaneously in the industry. All of these comments serve to stress the point that, although the life-cycle approach is a useful frame of reference, it has to be applied in a highly judicious way. There is a final warning that we would like to address pertaining to the use and applicability of the ADL strategic planning process. There are clearly some advantages in having a well organized, disciplined methodology to facilitate the formulation and development of strategies. Its counterpart, however, is that excessive rigidity could lead to a mechanistic type of thinking which would stifle rather than enhance creativity. Although ADL would never intend to apply its methodology that way, in uninitiated hands that tool could hinder a truly innovative way of thinking.
( 5 )